
What if you, as a CMO, were able to show not only how much revenue your marketing investment will deliver, but when? Mike Colling explains how you can.
If ever you needed proof that most businesses see marketing budgets as a cost and not an investment, 2020 provided it. Figure 1 below shows what marketing directors expected to spend each year (in black), followed by the quarterly revisions to those budgets (in grey) and their final annual outcome (in orange).
With the exception of the boom years 2004-2008, pre-financial crash, where one might argue the whole world was mad, the picture has been depressingly familiar. The black line pokes up above all others in naïve optimism; the grey lines decline across the year as the reality of revenue shortfalls bites; the orange line is lowest of all, reflecting the reality of the dominance of the CFO in any budget negotiation.
2020 was all of this writ large: we entered the year with 16% of advertisers expecting budgets to grow, and by Q2 saw a net loss of 50%, with only a slight improvement by year-end with a net loss of 24% by Q4.
Figure 1: Evolution of total UK marketing budgets 2000-2021
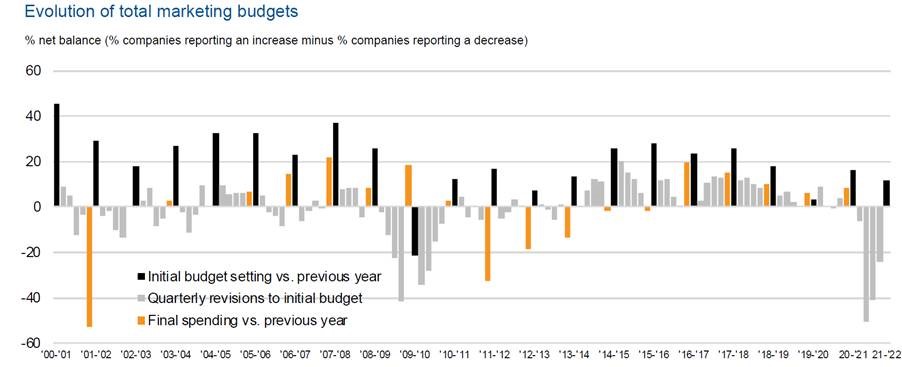
Source: IPA Bellwether Q4 2020
But even at the height of the pandemic in Q2, the 50% loss is a NET figure. These headline numbers conceal the Good, the Bad and the Ugly. The Ugly are the 64% of CMOs who had their budgets cut; the Bad are the 23% who merely held onto their budgets; and the Good are the 13% who managed the remarkable trick of actually increasing their spending April-June 2020.
The CMO’s crucial tools
Several of our clients were ‘Clints’ this year, which prompted us to ask what differentiates them from the typical CMO who regularly returned wounded from boardroom budget encounters. Our conclusion? The winners in the budget shootouts have two tools that the losers lack.
The first of these is attribution, or the ability to prove a causal relationship between marketing investments and sales revenue. This is worthy of a note in its own right, especially in the light of the changes to third-party cookie data on which digital attribution so often relies. It’s also the weaker of the two superpowers that the best CMOs possess, as other board members are often sceptical of overclaiming (look out for a separate note on this topic coming shortly).
The second and most important tool is predicting cash flow returns from the marketing investments you want to make. This year as in all recessions, the top of your CFO’s agenda has been liquidity and cash flows. The easiest budget to cut is the marketing budget as it tends to be deployed in-year, doesn’t impact headcount, and is believed to be a cost and not an investment – even in businesses where the marketing team has built a return-on-investment model.
How much revenue would you like and when?
There are two reasons why even if you have an ROI model, it won’t be enough to convince your CMO to withhold the axe. The good news is that both are within your control and can be shared with the CEO and CFO in terms that they will understand. Namely, “how much revenue would you like and when would you like it?”
Figure 2 (below) covers the “how much revenue would you like” question. Put simply, it costs you to grow by acquiring more customers, and the more you grow, the higher the cost per customer. The chart shows a theoretical customer universe (all the people who could ever buy your product) cut into deciles. In this case, we have created the deciles by their Life Time Value (or LTV), which is the cost of acquiring them as a new customer plus a proportion of the gross revenue you will earn from them whilst they are a customer.
When you start a small business, the costs to acquire new customers are low. The good news? Each of them is profitable if you only take marketing costs into account. The bad news? The gross profit volume from only one decile is low and may not cover the fixed overheads the business requires. That’s why most companies set their allowable cost per new customer at a relatively high proportion of LTV, so that a larger volume of profit is captured, albeit at a lower margin.
Figure 2: Set your cost per new customer higher to generate more profit (Within LTV limits)
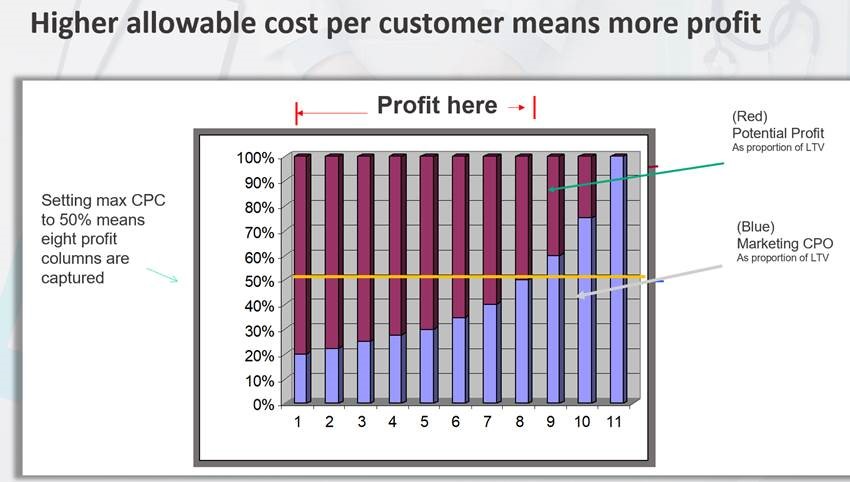
Source: The Kite Factory 2021
The tools associated with Figure 2 allow a discussion between a CMO and their CFO/CEO on variable costing and the revenue impact of not competing for a known and quantified share of the market in a budget period.
Having addressed the “how much revenue would you like” question, we come to “when would you like it?”. Many CMOs fall down at this point, and it’s a key focus for the powers that be. The quote “Turnover is vanity; profit is sanity; cash flow is king” is drummed into young accountants before they qualify.
“How much revenue will I have this month?” is a crucial question for any leader in any year, and ten times more so in 2021. Projecting a return on marketing investment is a partial solution, but only partial, as Figure 3 (below) demonstrates. This is an illustrative example from a (simplified) five-year cash flow model we build for clients who invest in acquiring new customers.
Reading across the grid at the top of the chart, you can see: marketing costs; number of prospect engagements and converted customers; the income they generate; in-year cash position; and the cumulative income, costs, cash position and ROI. The bottom right graph is the cumulative income vs cumulative cost position by month.
Figure 3: Summary outputs from a simple five-year cash flow model for customer acquisition
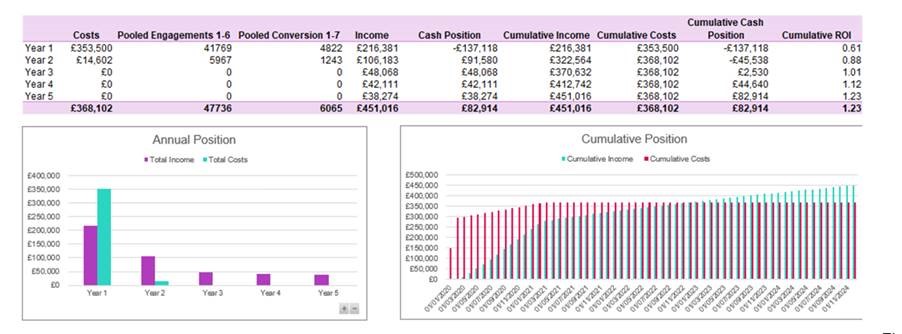
Source: The Kite Factory 2021
In a typical “CMOs are from Mars, CFOs are from Venus” example, we see a CMO promise the CFO an ROI of 1.23 on the marketing budget for which they are asking. The CFO hears “that’s net cash of £82,914 generated, this year”.
With a combination of these tools, the entire C-suite can engage in informed debate on the correct investment level using the same language and expectations of outcomes and ultimately agree that this is a pivotal investment, not a cost.
