
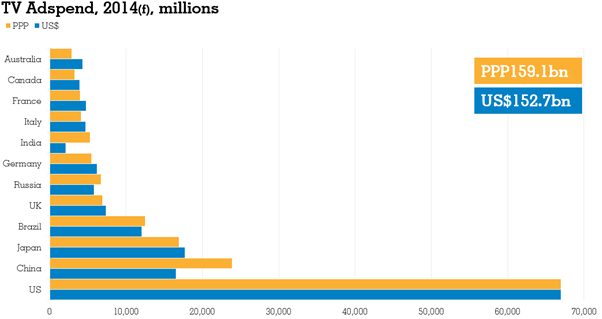
Data released in Warc's International Ad Forecast (IAF) last month show that TV, as a medium for advertising expenditure, is in robust health. What is more, expenditure will rise over the forecast period: we expect TV adspend in our 12 key markets to grow 4.6% on a PPP basis this year to total PPP159bn. A further 2.8% rise is forecast for 2015.
PPPs are a good gauge for comparing different markets as they show the rate at which the currency of one country would have to be converted into that of another country to buy the same amount of goods and services in each. A common example is the price of a hamburger: in London, it may cost £2, while in New York the same hamburger may be $4. This would imply a PPP exchange rate of 1 pound to 2 US dollars. Consequently, market exchange rates are taken out of the equation, and a clearer comparison can be made.

(Click to enlarge)
TV Adspend, PPP billion
Of the 12 featured markets, we expect TV adspend to rise fastest in Brazil this year (+13.6% in local currency), with expenditure boosted by the nation's hosting of the FIFA World Cup. TV adspend is forecast to account for PPP12.5bn in 2014. This TV total will, remarkably, comprise 64% of the all-media expenditure in the country over the course of the year. It also places Brazil as the fourth-largest TV adspend market of those featured in the forecast.
At the top of the list, with a TV adspend total five and a half times larger than Brazil's (indeed, larger than the combined Brazilian, Japanese and Chinese markets – 4th, 3rd and 2nd respectively), is, of course, the US, where expenditure is forecast to reach just shy of PPP67bn this year; around 42% of our twelve-market total.
(Click to enlarge)
TV Adspend, PPP billion
This year, TV adspend in the US will be boosted by a number of events, such as the Sochi Winter Olympics, the FIFA World Cup, and political spending in the run up to national mid-term elections. With these stimuli and others, TV advertising expenditure in the US will rise by 5.7% in 2014, equivalent to US$3.6bn. This is the largest rise since 2010, when the market rebounded after the global financial crisis wiped US$6bn from the US TV adspend market (and some US$26bn off advertising expenditure on the whole).
It will come as little surprise that such large sums are being invested, with more Americans watching TV, and for longer, than ever before. June data from the US Department for Labor Statistics found that Americans aged 15+ watch an average of 2.8 hours of live television per day, more than half of their leisure time. Nielsen believes exposure to be over 5 hours a day (when viewing via games consoles, DVD/Blu Ray devices and other multimedia devices is included), also noting that the average US TV household has access to over 189 channels.
But whoever it is telling you, the message is as clear as Ultra HD: competition for eyeballs has never been fiercer, and advertisers are willing to spend more to reach them. Warc's latest Media Inflation Forecast estimated that the Cost per Thousand for a 30 second TV spot in the US will rise 4% during 2014.
Warc subscribers may like to browse the TV Effectiveness Topic Page for the latest on TV, or use the Case Finder tool for evidence and ideas.
