FIGURE 5: LIKELIHOOD RATION TESTS OF PARAMETER RESTRICTIONS
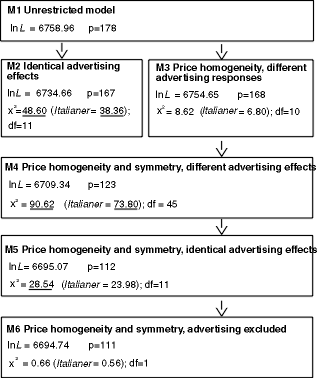
Notes: In the diagram, x2 = -2 (lnLr
- lnLU), where lnL is the log value of the likelihood function, with
the subscripts R and U denoting the restricted and unrestricted cases, respectively.
Underlining indicates likelihood ratio statistics which exceed the 1% level critical
values for this statistic which is distributed asymptotically as a chi-square variate. For
each model, p indicates the number of freely estimated parameters. Italianer
denotes the likelihood ratio statistic after adjustment by a small sample correction
factor. Critical x2 values (1% level) as follows: 6.64 for degrees of
freedeom (df) = 1, 23.21 for df = 10, 24.72 for df = 11, and 69.92 for df = 45 (by linear
interpolation between adjacent values in the tables in Lindley and Scott, 1984).