Farm Road, Henley-on-Thames, Oxon RG9 1EJ, UK
Tel: +44 (0)1491 411000 Fax: +44 (0)1491 571188
| Published by NTC Publications Ltd Farm Road, Henley-on-Thames, Oxon RG9 1EJ, UK Tel: +44 (0)1491 411000 Fax: +44 (0)1491 571188 |
Vol 18 No 2 (1999) |
This paper addresses the question: can firms in the food processing industry influence household diet, for better or for worse, through their advertising campaigns? This issue is investigated through the estimation of an advertising-augmented Rotterdam model for 11 broad food groupings using time series data spanning the 1969-1996 period in the UK. The econometric estimates reveal no evidence of advertising affecting the demand for food as a whole at the expense of non-food demand. There is almost no evidence of advertising affecting the product composition of any given level of total food demand.
This paper examines the influence of food advertising in the UK upon consumer preferences and behaviour across 11 broad product categories. The scale of advertising in this sector is substantial, as can be seen from the summary statistics presented in Table 1. Notable features of the figures in that table include the large proportions of total food advertising which are devoted to the promotion of sugar, confectionery and soft drinks brands. In comparison, very little is spent on advertising, for example, fish and fruit.
This uneven distribution of advertising expenditure has attracted the attention in recent years of several commentators who have claimed that firms in the food processing industry do influence, often adversely, the nation's diet through their advertising campaigns, even though the advertising is almost completely brand-oriented (at least, in the UK) with very little generic element. On the basis of a review of the statistical evidence, Henry (1996) argued that advertising can be an effective tool of competition between brands, but in mature food markets it seems to have no effect on total market size. If anything, he wrote, 'an increase in advertising volume tends to be associated, if only slightly, with a decrease in sales' (p 19). Some countries have placed controls on the volume of food advertising; for example, Erlichman (Guardian, 1993) reported: 'Advertising on children's programmes is banned in Sweden and Canada. Confectionery advertisements are banned in Holland until after 8pm.'
| Advertising expenditure (current prices) on TV, press and radio | Share of product advertising in total food advertising | Ratio of product advertising to consumers' expenditure on the product | |
| (£m) | (%) | (%) | |
| Bread and cereals | 140.3 | 19.6 | 2.0 |
| Meat and bacon | 67.6 | 9.4 | 0.6 |
| Fish | 5.7 | 0.8 | 0.3 |
| Milk, cheese and eggs | 41.0 | 5.7 | 0.7 |
| Oils and fats | 34.5 | 4.8 | 3.2 |
| Fruit | 4.9 | 0.7 | 0.2 |
| Potatoes and vegetables | 58.6 | 8.1 | 0.8 |
| Sugar, preserves and confectionery | 151.6 | 21.2 | 3.2 |
| Tea, coffee and cocoa | 44.0 | 6.1 | 3.4 |
| Soft drinks | 88.4 | 12.3 | 2.5 |
| Other manufactured food | 80.6 | 11.2 | 4.4 |
There have also been recent, controversial calls for banning or severely restricting various forms of food advertising in the UK, such as those by Dibb (1993) and Marks (1985). Dibb's report said advertising needed to be restricted because the bulk of the £523 million spent in 1992 on food advertising focused on sugary cereals, chocolate bars and fatty snacks, eaten in particular by children. In contrast, the Department of Health had issued warnings about increasing obesity and signalled the need for sharp reductions in sugar and fat consumption (HMSO, 1991). Dibb has been quoted as saying: 'We are asking whether it is socially responsible to permit advertising which runs counter to official government health policy' (Guardian, 1993). For an alternative view about the potency of food advertising and a critique of the Dibb report, see Barwise (1994).
The assertion that food industry advertising can influence consumer preferences across products may appear to many people to be as plausible as the belief held by official agencies that they can change behaviour through health campaigns and by disseminating dietary advice and information. However, the comparison between the two types of campaign is not so straightforward. The 'advertising' that governmental and medical organisations undertake is generic in character, quite different in nature from firms' advertising of their brands.1 It may be reasonable to expect the 'broad brush' approach of official health campaigns to affect the pattern of purchases across aggregate product groups, but it does not follow that individual firms' brand advertising will necessarily have similar effects at the product level. In simple terms, there are likely to be a lot of cancelling-out effects across brand sales, with perhaps little or no increase in total product demand in the sector.
Advertising may have the power to influence potential brand sales, but the possible increase in demand may fail to occur if rival firms respond with advertising campaigns to maintain, or even raise, demand for their brands. Moreover, any putative influence of brand advertising upon a product's total sales could be attenuated further by the countervailing influence of advertising on other products.
It is worth noting also that food advertising campaigns take place in the context of a series of interconnected markets which are regularly exposed not only to other types of product advertising but also to a great deal of information on diet and health. Advertisers seek to provide `positive' information about any brand or product, while the medical profession and media supply 'negative' information about some products (dairy products, refined sugar, red meat) and 'positive' information for others (wholegrain cereals, vegetables, fruit, fish, poultry).
In some cases, private 'positive' advertising may reinforce the message of public 'positive' advertising, a situation that presumably gives no cause for concern. Ippolito and Mathios (1995) reported evidence of such a reinforcing effect. The authors examined changes in US fat and saturated-fat consumption over two time periods as information spread connecting these lipids to heart disease and cancer risks. The first period spanned 1977-85 when government agencies and the media spread the message about the links between fats and disease risks, and when firms could label these characteristics on food packages and in advertising. In the second period, 1985-90, a regulatory ban was lifted which had prevented firms from explaining why consumers should be aware of the content of foods - i.e. firms were allowed to make 'health claims' in labelling and advertising. Comparison of these two periods led the authors to conclude that:
Consumers reacted to the information throughout the period but the rate of change increased considerably after 1985, when producer health claims added to the information flow. The results are consistent with an information role for advertising and inconsistent with the alternative hypothesis that the change in policy undermined education efforts that had been made by that time. The regulatory experiment of the 1985-90 period suggests that advertising may play an important role in spreading this type of information.
In contrast, critics of food advertising have a different scenario in mind where, they claim, advertising provides `positive' information about a product in a way which is tantamount to being deceptive and for the purpose of undermining public education efforts. In this second, problematic case, the privately supplied flow of information conflicts with the public information on the product, and the crucial issue is whether consumers' responses to negative information (health education) outweigh their responses to so-called positive information (provided by firms' advertising).
Several studies have addressed this issue and found evidence to support the view that unfavourable product information depresses demand far more than it is stimulated by 'positive' information supplied through advertising. Chang and Kinnucan (1991), for example, examined the hypothesis that unfavourable product information may have a greater effect upon consumer behaviour than similar amounts of favourable information. This can be so for several reasons, including doubts about the veracity of information provided by vested interests (advertising) coupled with a greater sense of trust in government and the medical profession. They wrote:
Consequently, unfavourable information has more dispositional value to an object, is discounted less, and therefore disproportionately influences impressions, beliefs, and attitude.
Chang and Kinnucan examined the roles of cholesterol information and advertising in explaining consumption trends for fats and oils, focusing on butter consumption in Canada. They concluded: 'For butter it appears that negative information over the sample period was about four times more potent than positive information in influencing consumption behaviour' (p 1202).
The chief aim of a recent study by Kinnucan et al. (1997) was to determine the effects of health information and generic advertising on meat consumption patterns in the US. Generic advertising is generally found to have a non-significant effect upon consumption and the results are described as 'fragile', while estimated health information effects are described as 'robust' (p 20). Poultry, for example, appeared to have benefited from the dissemination of cholesterol-related health information largely at the expense of beef. They concluded:
Thus, while we can be confident that meat consumption patterns are influenced by relative prices, total meat expenditures, and health information, no such confidence can be placed in the effects of advertising.
Further support for the hypothesis that unfavourable product information can neutralise similar amounts of positive information (supplied through advertising) many times over is provided by several econometric studies of the effect of advertising on cigarette consumption. Duffy (1996) reports estimates of negative effects of advertising on cigarette consumption, and suggests, by way of explanation, that 'cigarette advertisements may paradoxically reinforce and disseminate the health education message through their warnings content'. Stewart (1993) found that where countries ban cigarette advertising, smoking tends to increase: banning advertising also bans the associated health warnings, and this has a positive effect on consumption. Hamilton (1972) estimated that growing health awareness in the US had depressed cigarette consumption much more than cigarette advertising could have raised it. The study's main conclusion was that the 1971 ban on broadcast cigarette advertising (by abolishing not only cigarette advertising but also the Fairness Doctrine anti-smoking publicity) had probably had the net effect of increasing cigarette consumption in that country.
These studies are not exceptional. Many other authors have arrived at similar conclusions about the impact of advertising on product demand. Thus Goddard and Amuah (1989) examined the impact of advertising on demand for Canadian fats and oils through a translog demand system, and found that while advertising may have affected the demand for individual fats and oils over the 1973-86 period, aggregate demand for these products was unresponsive to advertising. Cox investigated the same markets using a Rotterdam-type demand system. He commented on some reported estimated advertising elasticities as follows:
Unfortunately, they are quite robust with respect to signs that are exactly opposite to most researchers' prior expectations; i.e., negative own and positive cross-advertising effects for butter and margarine Either this general demand systems approach is seriously flawed, or these data are trying to tell us something!
The demand-system results in Cox (1992) suggest that butter advertising and consumption were inversely related over the 1978-86 period. He felt that these results may not be unrealistic, for health/diet-induced concerns about cholesterol from animal fats such as butter were not explicitly accounted for in this research. He puts forward a view which is similar to that advanced by Chang and Kinnucan (1991), namely that unfavourable information (`badwill') about the product may have a much larger effect upon demand than positive information disseminated through the industry's 'goodwill' advertising. He adds the further ironic point that industry advertising may induce recall of, among other things, all the alleged bad aspects related to consumption of this product. In that way, butter advertising may actually contribute to a reduction in butter consumption. In other words, brand advertising may exert in certain circumstances an adverse externality on total product demand, the opposite of the frequently advanced Galbraithian view of advertising's expansive effects. Chang and Kinnucan (1991) estimated an Almost Ideal Demand System (AIDS) for Canadian oils and fats, and their estimates implied again that butter advertising, which is generic in type, caused the demand for butter to decrease. Their estimates also indicated that advertising has no impact on the product market shares in the fats and oil grouping.
A study which came to a similar conclusion is that by Jensen and Schroeter (1992) who conducted an econometric analysis of fresh beef consumption data for households participating in a controlled, experimental investigation of television advertising effects on beef demand. Their study concluded that advertising campaigns did not increase, and may even have decreased, the panellists' demand for beef. In addition, Goddard and Cozzarin (1992) carried out a large-scale demand-system study for nine food commodities and obtained very mixed results, with several own-advertising elasticities appearing to be negative.
Several studies have found correctly signed (positive) advertising effects on product demand, but the estimates are frequently very small and insignificantly different from zero. Thus, Baye et al. (1992) included advertising in an Almost Ideal Demand System for six product groupings in the US, including food, but they found that 'advertising does not generally have a statistically significant positive effect on the demand for the advertised good' (p 1093). In another AIDS study (of meats, dairy products, cereal and bakery products, fruit and vegetables, and all other foods consumed at home), Chang and Green (1992) found that advertising was 'generally insignificant in explaining the variations in food consumption' (p 113).
In contrast to all of the above results, several studies claim to have found evidence that advertising can stimulate the demand for some food product groupings. However, as with all advertising studies, results need to be assessed carefully, bearing in mind differences in the characteristics of both the products and types of advertising campaign studied. Ward (1992) observed that generic and brand advertising should have at least similar effects where the product is homogeneous and cannot be differentiated significantly within its group. However, generic advertising may be more informative than brand advertising, causing it to be more effective in influencing the demand for such a product.
Furthermore, brand advertising for a homogeneous product will struggle to have any effect upon market shares. On the other hand, where the product market is segmented into a set of clearly differentiated brands, brand advertising will be more effective than generic advertising (being more focused to specific target audiences and attributes), and its impact will be primarily seen in terms of altering brand market shares. Thus, Jones and Choi (1992) find evidence of a significant impact of generic advertising on fresh potatoes and a positive brand impact on processed potatoes, mainly potato chips. Ward (1992) notes that brand advertising is almost exclusively limited to the processed potato sector, so he is not surprised to see the importance of the brand effort. Generic advertising covers both fresh and processed potatoes, but has a fresh orientation, as one would expect from the above hypotheses.
The demand for orange juice (OJ), which is much closer to being a
homogeneous product than processed and fresh potatoes, was studied by Brown and Lee (1997)
through estimation of an advertising-augmented demand system for five OJ brands and a
sixth category for all other juices and juice drinks in the United States (see also Brown
and Lee, 1993, and Lee and Brown, 1992). Total OJ demand appears to have been stimulated
by both generic and brand advertising, although the advertising elasticities were very
small (Brown and Lee, 1997, Table 3). The generic advertising elasticity for the orange
juice group was estimated to be 0.03, indicating that a 100 per cent increase in OJ
advertising would raise overall demand for orange juice by only three per cent. The
authors noted that the OJ group elasticity with respect to advertising of each brand is
much smaller than the generic advertising elasticity (and several were close to zero).
These results are consistent with the above hypotheses advanced by Ward (1992) with regard
to the relative effectiveness of generic and brand advertising of a homogeneous good.
Venkateswaran and Kinnucan (1990) estimated various functional forms for a single equation
model of milk sales and concluded that 'the generic advertising program for fluid milk in
Ontario has significantly increased milk consumption'. The estimated elasticities were
much smaller for advertising (0.04 to 0.06) than for income (0.6 to 0.8) or own-price
(-0.14 to -0.19). Ward and Dixon (1989) also estimated a statistically significant
relationship between fluid-milk consumption in the US and generic fluid-milk advertising.
Bjørndal et al. (1992) found that advertising was effective in expanding the
demand for salmon in France. The estimated long-run elasticity of French salmon with
regard to the Norwegian Fish Farmers' Sales Organisation's (FOS) marketing budget was 0.2,
small again compared with the own-price elasticity of -1.3 and income elasticity of 2.3.
In each of these cases the product studied is homogeneous and the results square with
Ward's (1992) hypotheses.
In other studies, the correspondence between results and prior hypotheses and expectations has been less clear-cut. Brester and Schroeder (1995) used a non-linear Rotterdam model to estimate the effects of brand and generic meat advertising on meat-commodity demand (beef, pork, poultry and other). Results were mixed. Thus, generic beef and pork advertising were found to have effects on beef and pork demand which were insignificantly different from zero. In contrast, branded beef and poultry advertising were estimated to have increased overall demand for meats as a group.
Green et al. (1991) estimated an advertising-augmented Almost Ideal Demand System for Californian figs, prunes and raisins. The authors found that generic advertising effects for these commodities are weak in comparison to price and 'income' (total expenditure) effects. Indeed, they found no evidence that advertising for figs had any positive impact on the demand for figs.
This brief survey of a sample of recent studies of advertising and food consumption indicates that no consensus view has yet emerged about the potency of generic and brand advertising in these markets. The fact that these studies come to very different conclusions may not be surprising given the marked variations in product detail considered, models specified and datasets employed by the authors. Controversy is indeed the natural consequence of such differences in methodology and applications, though the eternal hope is that progress is possible through the accumulation of evidence across many studies which will eventually favour one hypothesis more than another.
The aim of this paper is to add to the growing stock of knowledge in this area by examining the effect of advertising upon the pattern of food consumption in the UK through the estimation of an advertising-augmented demand system which is described in the next section. The third section describes the data and estimation procedures. Estimation results and hypothesis tests are reported in the fourth section, and the final section summarises the main conclusions reached in this study.
In recent years a popular approach to testing for advertising effects upon the pattern of demand in food, drink and tobacco markets has been through the estimation of advertising-augmented demand systems such as the Rotterdam model (Theil, 1975, 1980) or Almost Ideal Demand Systems (Deaton and Muellbauer, 1980).2 These system-wide models of demand provide a useful framework for investigating advertising effects on the inter-product distribution of demand. The models are based on classical-demand analysis, which is fundamentally a theory concerning the optimal allocation by consumers of their expenditure across products, and it is frequently alleged that advertising changes that allocation. As Galbraith wrote:
If advertising affects the distribution of demand between sellers of a particular product, it must also be supposed that it affects distribution as between products...It is true that the consumer may still imagine that his actions respond to his own view of his satisfactions. But this is superficial and proximate, the result of illusions created in connection with the management of his wants. Only those wishing to evade the reality will be satisfied with such a simplistic explanation. All others will note if an individual's satisfaction is less from an additional expenditure on automobiles than from one on housing, this can as well be corrected by a change in the selling strategy of General Motors as by an increased expenditure on his house.
Comanor and Wilson (1974, p 88) came to the remarkable conclusion that:
The argument that advertising serves merely to allocate spending between brands within broad groupings of products is called into question by these results. If anything, advertising comes through as a more important determinant of the inter-industry allocation of sales than are relative prices.
It would seem more appropriate, therefore, to investigate the system-wide effects of advertising on demand via the estimation of a system of demand equations rather than single, isolated demand equations, one for each product.
Out of the various available model specifications, the Rotterdam model was chosen as the framework for the research reported here. It has several desirable features: it is based on demand theory, the parameters of the model can be interpreted meaningfully in terms of the underlying theoretical restrictions, and the model is easy to estimate econometrically. The discrete Rotterdam model is a valid linear approximation in variable space to any underlying demand system, and the order of approximation is no lower than that for other flexible functional forms such as the translog and AIDS (Mountain, 1988). Finally, some recent studies have presented evidence to support the view that the Rotterdam model, judged by various criteria (goodness of fit, post-sample predictive performance, stability, plausibility of elasticity estimates and so on) may outperform the main alternative, the AIDS specification (Alston and Chalfant, 1993; Duffy, 1995).3
It is assumed in this analysis that the consumer's utility function is weakly separable in foods and other groups, and can be regarded as a tree with a branch utility function for each broad product grouping, including food. Weak separability is necessary for the consistency of the 'two-stage budgeting procedure' discussed by Strotz (1957) and Gorman (1959). In the first stage of this procedure, households are assumed to allocate their income among broad groups (or branches) of goods. In the second stage the total allocated expenditure on each group serves as a budget constraint on the maximisation of the branch utility function, leading to the selection of optimal quantities of the various goods in that branch as functions of those goods' prices and the total group expenditure. This paper is concerned with modelling both stages of this procedure through the specification and estimation of (second stage) conditional demand equations for 11 different types of food and non-alcoholic drinks together with a (first stage) group demand equation for the general food category as a whole.
The group demand equation serves to explain the total demand for all goods in the food group in terms of prices and advertising (both within and outside the group) as well as some measure of aggregate 'income'. The other 11 equations are termed conditional demand equations, for they determine demand for each of the food products by reference to prices and advertising (but only within the group) while controlling, or conditional upon, the total group demand for food. The two types of demand equation allow the economist to identify two separate effects of advertising (or prices) on demand for any product. The conditional demand equations estimate intra-group effects and the group demand equation measures inter-group effects.
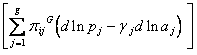
Advertising outlays by firms are assumed to influence the demand for the various goods in the system by altering consumer tastes. To be specific, following Theil (1980), the marginal utility of the ith good is assumed to vary directly with advertising on the ith good (but is not affected directly by advertising on other goods) in a relationship which may be formally expressed as follows:
where dlnMUi is the differential of the logarithmic value of the marginal utility of consuming the ith good, dlnai is the differential logarithmic value of real advertising expenditure per head on the ith good and the coefficient gi measures the elasticity of the marginal utility of the ith category of food consumption with respect to advertising on that product. The effect of a product's advertising upon the marginal utility of a different product is assumed to be zero in this model for several reasons. First, the scale of the model in this study, with 11 distinct product classes (and consequent large numbers of price, income and own-advertising gi parameters) renders the estimation of the additional 110 'off-diagonal' coefficients (linking dlnai with dlnMUj i ¹ j) extremely difficult. Second, advertising effects at the level of product aggregation used in this study may be confined predominantly to own-product marginal utilities. The higher the level of aggregation, the lower the availability of good substitutes as product classes become especially distinctive and, as a consequence, the more attenuated cross-product advertising effects will become.
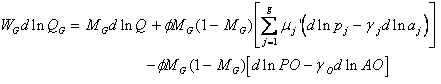
Working from both the relationship above and preferences which are treated as block independent, it may be shown that the advertising-augmented, absolute prices version of the Rotterdam model's conditional-demand equations within a group (denoted by G) can be written in its infinitesimal form as follows:4
(1.)
where g denotes the number of products in the group, wi represents the share of expenditure on the ith good in total consumers' expenditure on all goods, WG (the sum of wi from i = 1 to g) is the group's budget share, qi is the quantity of good i consumed per head in a period, pi is the price of good i, and
![]()
is the Divisia volume index for group G. The coefficient m'i is a conditional marginal share and it measures how much of any increase in expenditure on the G group (arising from a £1.00 increase in income) finds its way into an increase in expenditure on the ith good in the group. The coefficients in the demand equation system (equation 1) are subject to the following 'adding-up' constraints:
The adding-up constraints on the parameters ensure that individual
equations' predictions of demand add up to equality with total demand for all goods in the
system.
The coefficient is the ijth element of the conditional Slutsky matrix of
the commodity group G. It is useful to consider two sets of testable restrictions on the
conditional Slutsky coefficients, for valid restrictions can reduce the dimensionality of
the estimation space and improve the efficiency of the estimates. First, there are the
demand homogeneity constraints:
If the estimated parameters satisfy the homogeneity constraints, then an equi-proportionate increase in all food prices would leave the commodity composition of total food demand unchanged. In those circumstances it is relative food prices only (not their absolute level) which alters food demand within the group.
Second, there are the Slutsky symmetry constraints:
The results for tests of the validity of these restrictions are reported in the fourth section. It should be noted that price homogeneity and Slutsky symmetry are sufficient conditions in this model for the existence of, respectively, homogeneity and symmetry in advertising effects.
The coefficients pij G are the conditional Slutsky coefficients and each one measures the ceteris paribus effect of the differential change in the logarithmic value of the jth product's price upon the dependent variable, the budget share-scaled value of the differential change in the logarithm of real per capita consumption of the ith product. The cross-product term gjpij G is the derived advertising coefficient which measures the impact of the differential log change in real per capita advertising of the jth good upon the left-hand side measure of demand for the ith product.
In terms of economic behaviour, equation 1 indicates that the change in
real consumption of the ith type of food ![]() may be influenced by changes in both real total food expenditure
may be influenced by changes in both real total food expenditure ![]() and the product prices after scaling by
advertising effects:
and the product prices after scaling by
advertising effects:
In the advertising-augmented Rotterdam model, advertising on the jth good affects the product demand by raising the amount of satisfaction that the average consumer gains from consuming one more unit of that good, with the parameter gj measuring the strength of that effect upon marginal utility. At unchanged actual prices, this increase in the perceived 'worth' (in terms of consumer satisfaction) of the good is tantamount to a reduction in the effective, or quality-adjusted price, of the good, which leads by the 'law of demand' to an increase in desired consumption of that good. This is the interpretation to be placed upon the presence in equation 1 of the advertising-scaled prices of the various goods. By this interpretation, the impact upon demand of advertising of good j will depend not only upon gj, but also upon the price coefficients pij G. Thus, advertising may change consumer tastes (gj>0), but the impact upon demand could be minimal if the price coefficients are very small and close to zero. Price elasticities tend to be low for food products.
The group demand equation has the same specification as that used in Duffy (1987):
(2.)
where MG is group G's (i.e. food's) marginal share (that is, MG measures how much, on average, of an extra pound of real income is spent on the group G (food) as a whole), the term dlnPO denotes the change in the log value of an aggregate price index for all goods outside the food sector, and dlnAO is the change in the log value of advertising on the same non-food, non-durable goods. The parameter is the so-called income flexibility parameter, being the reciprocal of the income elasticity of marginal utility. The parameter go is a weighted average of the gj's for goods outside the food group, with weights that sum to unity, and so it may be interpreted as an index of average advertising effectiveness outside the food sector.
Equation 2 models the determination of log changes in total real expenditure on the food group by reference to log changes in both aggregate 'income' (total consumers' expenditure) and a Frisch measure of advertising-scaled prices within the group relative to those outside the group.
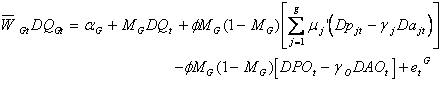
To move to an estimable form of the demand system comprising equations 1 and 2, the differentials in the logarithms of qi, pi and ai (where i = 1,2...g) are replaced by first differences of logarithmic values. All variables, including the wi, have to be dated, although the standard approach, also used here, is to replace the budget shares by their two-period moving average:
Constants are also introduced into the estimating equations which, it is hoped, measure the steady, systematic effects of factors other than 'income' (total food demand), prices and advertising, such as health education and dietary advice, on the demand for each of the food products. The adding-up condition implies that the estimated constant terms must total zero across all equations. This means that any autonomous increases in demand for some food products must be offset exactly by retrenchment in demand elsewhere in the system for other food products, so that the aggregate effect of these autonomous changes in demand upon total food demand is zero.
Figures 1, 2, 3 and 4 contain graphs of the logarithmic values of real per capita consumption (lnqi) of the 11 different types of food over the 1969-95 period. The charts reveal some pronounced trend movements in several consumption categories, with increased consumption of bread and cereals (lnq1), fish (lnq3), fruit (lnq6), potatoes and vegetables (lnq7), soft drinks (lnq10) and other manufactured foods (lnq11), in the presence of falling average consumption levels for milk, cheese and eggs (lnq4), oils and fats (lnq5), and tea and coffee (lnq9). There appears to be no pronounced trend change over this period in the average level of either meat and bacon (lnq2) or sugar, preserves and confectionery (lnq8). To some extent, these trend changes (with the exception of that for soft drinks) may reflect autonomous shifts in consumer preferences derived from increased concern about the link between diet and health.
When these changes to the demand system (equations 1 and 2) are made, the final estimated form for the conditional equations can be written as follows:
(3.)
with the group demand equation for estimation taking the form:
(4)
where D is the first difference operator, all variables are transformed to their logarithmic values (but the ln operator is omitted to simplify notation), vGt is the sum of vit from i = 1 to g, ai is the constant intercept term in the ith equation (with aG being the intercept in the group case) and eitG and etG are random disturbances.
The system of demand equations 3 and 4 was regarded as a set of seemingly unrelated equations, and estimated by the Time Series Processor (TSP) package, version 4.2B. In this procedure the disturbances in the equation system are assumed to have zero expectation, constant contemporaneous covariance matrix and no serial correlation. Since the adding-up condition requires inter alia:
(see Theil, 1975, Volume II, pp 1-3), the variance-covariance matrix for the errors in the system of conditional demand equations is singular. However, this does not pose an insuperable problem for estimation since an arbitrary demand equation may be deleted with parameters of the omitted equation being calculated from the remaining adding-up constraints. The eleventh equation for 'other manufactured food' was deleted from the model specification prior to estimation.
Quarterly, seasonally unadjusted time-series data spanning the period 1969Q1 to 1996Q1 were employed to estimate and assess the demand system in 11 products. Full details about the data definitions and their sources are given in Appendix A.
This section reports the results of estimating and testing the demand system described in the second section. A 'testing-down' procedure has been followed, one that starts with the most general, unrestricted form of the demand system as specified in equations 3 and 4, and then considers whether other forms of model derived from the restrictions of economic theory are consistent with the data. The initial demand system is so large that any `data consistent' reductions in the number of parameters and variables in the model are welcomed for reasons relating to gains in efficiency of the estimators, together with increased precision in estimation as the incidence of multi-collinearity is probably reduced.
The testing-down procedure moves through increasing orders of restrictiveness, stopping where a significant test is encountered (or the most restricted hypothesis is reached without a significant test being reached). For in this ordering of nested hypotheses, if any hypothesis is true, all preceding hypotheses must be true, and if any hypothesis is false, all succeeding ones must be false.
Application of the procedure is complicated by the fact that, in this case, the hypotheses are not uniquely ordered. All that is required, then, is that the testing-down procedure is applied to each possible ordering of the set of hypotheses, although this modified procedure could lead in turn to another problem being encountered: the selection of preferred hypotheses which differ between orderings. In that event, other criteria have to be used for discriminating between these preferred hypotheses. However, in anticipation of the results reported below, it can be stated that this situation was not encountered in the current study.
Six hypotheses or models, referred to as M1 to M6, were considered in the testing-down procedure, and they are defined in terms of the restrictions that they embody in Table 2.
| Model | Restriction imposed | ||
| M1 | No restrictions: | the maintained hypothesis (equations 3 and 4) | |
| M2 | Identical advertising effects: | gi = gj = go | [i, j = 1, 2...g, i ¹ j] |
| M3 | Price homogeneity: | [i = 1, 2...g] | |
| M4 | Price homogeneity: | [i = 1, 2...g] | |
| and symmetry: | pij = pji | [i, j = 1, 2...g] | |
| M5 | Price homogeneity: | [i = 1, 2...g] | |
| and symmetry: | pij = pji | [i, j = 1, 2...g] | |
| and identical advertising effects: | gi = gj = go | [i, j = 1, 2...g, i ¹ j] | |
| M6 | Price homogeneity: | [i = 1, 2...g] | |
| and symmetry: | pij = pji | [i, j = 1, 2...g] | |
| and no advertising effects: | gi = gj = go = 0 | [i, j = 1, 2...g, i ¹ j] | |
The results of applying the testing-down procedures via a sequence of likelihood ratio tests are reported in Figure 5. Since these tests are asymptotic in nature, and various studies have clearly identified a problem of over-rejection in finite samples (especially when large models are estimated - see Bera et al., 1981; Laitinen, 1978; and Meisner, 1979), Figure 5 contains not only the unadjusted test statistics, but also the version modified by a degrees of freedom factor suggested by Italianer (1985). All hypotheses are tested at the one per cent level in order to restrain the significance level for the overall implicit test of the most restrictive hypothesis (M6) against the totally unrestricted model (M1) to a level below five per cent (Mizon, 1977, p 1226).
The testing sequence begins with a comparison of models M1 and M2 in order to assess the assumption made initially by Theil (1980) that the impact of advertising on the marginal utility of consumption is invariant across products. That is, the following restrictions are imposed in M2 but not in M1:
These restrictions are rejected decisively by both versions of the likelihood ratio test, which means that other, more restrictive models should not be compared with M2 in further tests in the ordering which starts with the sequence (M1, M2).
In an alternative ordering, M3 is nested within the maintained hypothesis M1. Given that homogeneity is the weakest of the restrictions of economic theory in demand analysis (being implied simply by the budget constraint, without reference to the structure of consumer preferences), it is reassuring to observe in Figure 5 that this set of restrictions is not rejected in the test comparing M3 with M1, even without small sample adjustments to the statistics.
Moving on to compare model M4, incorporating price symmetry as well as price homogeneity restrictions, with M3 (price homogeneity only), significant test statistics for both versions are encountered. The testing-down procedure must stop, therefore, at M3, which is the most restrictive model that is deemed to be consistent with the data. By the logic of this process, therefore, the subsequent results in the lower levels of the test procedure (which indicate, at least in terms of the Italianer version of the test statistic, that advertising may be excluded without any significant drop occurring in the maximised value of the likelihood function) are irrelevant.
| Intercept | Conditional marginal shares | Own conditional price coefficient |
Advertising elasticity of marginal utility | Own conditional advertising coefficient | |
| ai | m'i | pii G | gi | -gipii G | |
| Bread and cereals | 0.00070 | 0.15200 | -0.02040 | -0.01400 | -0.00030 |
| (3.33100) | (11.89950) | (5.53520) | (0.85190) | (0.84760) | |
| Meat and bacon | 0.00210 | 0.46590 | -0.03860 | 0.02310 | 0.00090 |
| (4.44410) | (18.94880) | (5.15120) | (2.56370) | (2.59360) | |
| Fish | -0.00004 | 0.00460 | -0.00500 | -0.00770 | -0.00004 |
| (0.32870) | (0.59270) | (2.59100) | (1.13970) | (1.08020) | |
| Milk, cheese and eggs | -0.00001 | 0.015700 | -0.00040 | -0.21050 | -0.00008 |
| (0.05060) | (1.14970) | (0.22800) | (2.21200) | (0.22810) | |
| Oils and fats | 0.00100 | -0.01350 | 0.00010 | 0.60680 | -0.00005 |
| (10.9520) | (2.76520) | (0.48070) | (0.78300) | (0.44790) | |
| Fruit | -0.00190 | -0.01810 | -0.00840 | -0.01810 | -0.00020 |
| (7.60170) | (1.34630) | (4.08170) | (1.50570) | (1.48630) | |
| Potatoes and vegetables | -0.00270 | 0.25080 | -0.01310 | 0.01050 | 0.00010 |
| (6.19240) | (11.17840) | (5.70950) | (0.54720) | (0.54800) | |
| Sugar and confectionery |
0.00430 | 0.11010 | -0.00720 | -0.07280 | -0.00050 |
| (11.88290) | (5.04050) | (1.96870) | (3.04130) | (1.75030) | |
| Coffee, tea and cocoa |
0.00060 | 0.02140 | 0.00003 | 0.4949 | -0.00001 |
| (5.20010) | (3.18070) | (0.07360) | (2.96720) | (0.07370) | |
| Soft drinks | -0.00180 | -0.03820 | -0.01440 | 0.01650 | 0.00020 |
| (3.94890) | (1.65240) | (5.09610) | (1.05710) | (1.05910) | |
| Other manufactured food | -0.00210 | 0.04940 | -0.00420 | -0.02760 | -0.00010 |
| (4.57970) | (11.81320) | (1.47780) | (1.93460) | (1.20880) | |
| Group intercept |
Group marginal share | Income flexibility | Other advertising: average effectiveness |
||
| aG | MG | j | go | ||
| -0.01830 | 0.14900 | -0.80300 | 0.03150 | ||
| (6.48650) | (8.70490) | (5.84770) | (1.21100) | ||
Notes: Estimation period from 1969Q1 to 1996Q1 - asymptotic ratios in brackets. Estimates of seasonal dummy coefficients and cross-product price and advertising coefficients omitted. |
|||||
To save space, the estimates of only the major structural coefficients for M3 are presented in Table 3 (opposite) - the cross-product price and advertising coefficients, together with the estimates of the seasonal dummies' coefficients, are omitted. It is worth noting briefly some of the main features of the reported estimates. Several intercepts are significantly different from zero, although some of them, interpreted as proxies for trend changes in preferences, have signs that differ from those that could have been expected on the basis of a brief perusal of Figures 1, 2, 3 and 4. The estimates suggest that there may have occurred over the sample period autonomous shifts in consumer preferences towards bread and cereals; meat and bacon; oils and fats; sugar and confectionery; and coffee, tea and cocoa. At the same time, consumer preferences may have moved away from fruit; potatoes and vegetables; soft drinks; other manufactured food; fish; milk, cheese and eggs; and the food group as a whole.
The estimate of the food group marginal share, MG, indicates that, on average, 15p out of every extra pound spent on non-durable consumer goods is spent on food and soft drinks as a whole (ceteribus paribus). Estimates of the individual products' marginal shares suggest that out of every extra pound spent on food and soft drink, almost half (47p) goes on meat and bacon, followed in decreasing order of importance by potatoes and vegetables (25p), bread and cereals (15p) and sugar and confectionery (10p). These four food groups account together for 95 per cent of the extra pound of expenditure on food.
Several of the other food categories appear to contract in size (absolutely, not just relatively) as general food expenditure rises, since their conditional marginal shares are negative. It should be noted though that these negative effects are generally insignificantly different from zero.
In any econometric project, the estimated coefficients must be assessed by reference to various criteria, such as t-ratios relative to critical values, and correspondence with a priori expectations about sign and magnitude. In that appraisal, prices emerge in this study as not only far more important determinants of the inter-product distribution of demand than advertising expenditures (see Comanor and Wilson's (1974) conclusion, referred to above), but they also appear to have coefficient estimates which are of superior quality than are those for advertising.
In the long history of applied demand analysis, a great deal of evidence has been accumulated to support the view that for almost all products price is an important determinant of demand. It is reassuring, therefore, to find that most of the own-price Slutsky price coefficients in Table 3 are significantly different from zero and negative.5 Although the price coefficients for oils and fats and coffee, tea and cocoa are positive, those point estimates are insignificantly different from zero.
Turning to the estimated effects of advertising on consumer preferences (the advertising elasticity of the marginal utility of consumption) reported in the penultimate column of Table 3, the main points to note are that 9 of the 11 estimates are 'incorrectly' signed (i.e. negative) and/or insignificantly different from zero, and the average impact of advertising on other non-food preferences (go) appears to be insignificantly different from zero. In other words, a high proportion of the estimates suggest that advertising does not have any (meaningful) effect upon consumer preferences over most goods. There is evidence to support the view that consumer preferences for only 'meat and bacon', and for 'coffee, tea and cocoa' may be stimulated by advertising. However, the ultimate effect of advertising upon consumption of food is even more attenuated and confined to meat consumption. Advertising of beverages has no significant effect upon demand: the own conditional advertising coefficient is minute and insignificantly different from zero, presumably because the product's price coefficient is insignificantly different from zero.
It should be remembered that in this model advertising works by altering consumers' preferences and reducing the effective 'utility-adjusted' price as perceived by the consumer, thereby stimulating consumption. Conditional on preferences being affected, advertising's effects on consumption will be most potent when demand is price elastic. The latter condition may be satisfied frequently at brand level (where there are many good substitutes available), but it is less likely to hold for broad product groupings. The demand for each of the food categories in this study is estimated to be price inelastic (see Table 5). This characteristic of consumer demand in these markets probably undermines the ability of advertising to stimulate total product demand.
The only product that comes close to having a price elasticity of demand which is at least unity is soft drinks, but advertising does not appear to stimulate consumption in that case (insignificant own advertising coefficient). This is caused by the advertising elasticity of marginal utility for soft drinks being very small and insignificantly different from zero.
Finally, the estimated value of the income flexibility parameter j is similar to, though slightly larger in absolute terms than, those reported in several other studies (see Clements and Johnson, 1983; Duffy, 1987, 1991; Theil, 1975).
| A: Individual products | Conditional elasticities | Unconditional elasticities |
| 'Income' | m'i
wit/WGt |
m'iMG wit |
| Own price | pii G wit |
pii G
+ j MG (1 - MG) mimi wit |
| Own advertising | - gi pii G wit |
- gi {pii G + j
MG (1 - MG) mimi} { wit } |
| B: Group | ||
| 'Income' | Price | Advertising |
| MG WGt |
j MG (1 - MG) WGt |
j MG (1 - MG) |
It is often easier to assess estimated demand models in terms of demand elasticities rather than structural coefficients. The formulae for these measures of demand responsiveness, which are displayed in Table 4 above, clearly indicate that the elasticities in this model are not constant, but vary with changes in budget shares. However, calculation of elasticities period by period would result in a plethora of information, and for the sake of clarity, only summary measures of the conditional and unconditional elasticities, calculated by replacing the budget shares by their mean values over the sample period, are reported in Tables 5 and 6, respectively.
| Product group | Own conditional 'income' elasticities | Own conditional price elasticities | Own conditional advertising elasticities |
| Bread and cereals | 1.119 | -0.495 | -0.007 |
| (11.900) | (5.535) | (0.848) | |
| Meat and bacon | 1.777 | -4.484 | 0.011 |
| (18.949) | (5.151) | (2.594) | |
| Fish | 0.137 | -0.496 | -0.004 |
| (0.593) | (2.591) | (1.080) | |
| Milk, cheese and eggs | 0.109 | -0.008 | -0.002 |
| (1.150) | (0.228) | (0.228) | |
| Oils and fats | -0.379 | 0.008 | -0.005 |
| (2.765) | (0.481) | (0.448) | |
| Fruit | -0.311 | -0.476 | -0.011 |
| (1.346) | (4.082) | (1.486) | |
| Potatoes and vegetables | 2.119 | -0.362 | 0.004 |
| (11.178) | (5.710) | (0.548) | |
| Sugar and confectionery | 1.185 | -0.255 | -0.019 |
| (5.041) | (1.969) | (1.750) | |
| Coffee, tea and cocoa | 0.661 | 0.003 | -0.132 |
| (3.181) | (0.074) | (0.074) | |
| Soft drinks | -0.747 | -0.926 | 0.015 |
| (1.652) | (5.096) | (1.059) | |
| Other manufactured food | 1.378 | -0.381 | -0.011 |
| (4.580) | (1.478) | (1.209) | |
| Food group elasticities with respect to: | 'Income' | Food prices | Food advertising |
| 0.490 | -0.335 | 0.0002 | |
| (8.705) | (6.486) | (0.049) | |
Notes: elasticities derived from the structural estimates in Table 3 and the mean budget shares. 'Income' in this table denotes total consumers' expenditure on all types of food and soft drinks (constant 1990 prices). Asymptotic t-ratios are in brackets. |
|||
The 'income' elasticities in Table 5 may appear to be rather large for several products, given the well-known tendency for income elasticities to be low within the food sector. However, it must be emphasised that these are conditional elasticities, which assume a given level of demand for food as a whole, and ignore the inelastic response of food demand to changes in aggregate income. Since the group income elasticity of demand for food is indeed estimated to be as low as 0.5, it may be expected that individual goods' unconditional income elasticities will be on average half the size of the corresponding conditional elasticities. This expectation is borne out by the magnitudes of the unconditional income elasticities which are reported in Table 6. They confirm that the demands for the various food products (as for the group as a whole) do respond inelastically with respect to growth in `income' (i.e. total expenditure on non-durable consumer goods).
| Product group |
Own unconditional 'income' elasticities | Own unconditional price elasticities | Own unconditional advertising elasticities |
| Bread and cereals | 0.548 | -0.551 | -0.008 |
| (7.510) | (6.213) | (0.850) | |
| Meat and bacon | 0.870 | -0.761 | 0.018 |
| (8.203) | (7.331) | (2.610) | |
| Fish | 0.067 | -0.497 | -0.004 |
| (0.587) | (2.591) | (1.080) | |
| Milk, cheese and eggs | 0.053 | -0.009 | -0.002 |
| (1.126) | '(0.244) | (0.244) | |
| Oils and fats | -0.186 | 0.006 | -0.004 |
| (2.784) | (0.379) | (0.368) | |
| Fruit | -0.152 | -0.478 | -0.011 |
| (1.369) | (4.113) | (1.487) | |
| Potatoes and vegetables | 1.037 | -0.540 | 0.006 |
| (7.574) | (9.863) | (0.549) | |
| Sugar and confectionery | 0.580 | -0.299 | -0.022 |
| (4.487) | (2.302) | (1.949) | |
| Coffee, tea and cocoa | 0.324 | -0.002 | 0.001 |
| (2.961) | (0.057) | (0.057) | |
| Soft drinks | -0.366 | -0.935 | 0.015 |
| (1.682) | (5.243) | (1.058) | |
| Other manufactured food | 0.675 | -0.403 | -0.256 |
| (4.132) | (1.559) | (1.864) | |
Notes: The estimated unconditional elasticities of demand are derived from the structural estimates in Table 3 and the mean budget shares. 'Income' in this table denotes total consumers' expenditure on non-durable consumer goods (constant 1990 prices). Asymptotic t-ratios are in brackets. |
|||
The estimated price elasticities are in general highly plausible. The food-group price elasticity in Table 5 is low (-0.3) and the demand for each food product is found to be inelastic with respect to price in either a conditional or an unconditional sense. The unconditional price elasticities are larger than their conditional counterparts for the following reasons. A ceteris paribus fall in the ith food product's price exerts two effects on demand for that product, one direct, the other indirect:
The fall in price stimulates directly the demand for that product at the expense of other food products, conditional upon a fixed, total demand for food.
The fall in price for the ith product will contribute to a reduction in food prices in general, raising the total demand for food relative to other non-durable goods. This increase in the typical household budget for food stimulates the demand for each individual food product through the marginal shares (mi's).
While the conditional price elasticities allow for the first effect, only the unconditional price elasticities pick up both effects. As a consequence, the unconditional price elasticities are the larger (in absolute terms) of the two types of elasticity measure.
These results for price elasticities, like those for the income elasticities, are entirely congruent with prior expectations as well as other published estimates (Georgantelis et al., 1987; Ministry of Agriculture, Fisheries and Food, 1990). As such, they encourage confidence in the reliability and quality of the estimated model as a whole.
The conditional and unconditional advertising elasticities are in general insignificantly different from zero and/or have the 'wrong' sign (i.e. negative). The estimated negative effects of advertising on consumption echo the conclusion reached by Henry (1996). Meat and bacon is the only product category where advertising is estimated to have had a positive and significant (in a probabilistic sense) effect upon demand. Apart from some doubts about the reliability of this single, isolated 'positive' advertising effect, it should be noted that, with an estimated unconditional elasticity of +0.02, advertising is most unlikely to have been a major force in the determination of meat and bacon consumption over the sample period.
Furthermore, the estimated influence of advertising on total food demand is minute and insignificantly different from zero. The group advertising elasticity in Table 5 is 0.0002, meaning that a ten per cent increase in real per capita advertising on each category of food is associated with an increase in total food demand of about two thousandths of one per cent.
This study has investigated the influence of advertising upon the inter-product distribution of demand in the UK's food sector. The reported estimates of advertising effects are embedded within a demand system which seems to have empirical characteristics, particularly with regard to price and income, which are consistent in general with those in similar published studies. Even the advertising effects, often with negative sign and insignificantly different from zero, resemble those reported by many other authors, as reviewed in the introduction.
This study joins the accumulating number of studies that have found little or no evidence to support the view that advertising can affect the product composition of total food demand. In addition, the econometric estimates which have been presented above suggest that food advertising has no effect upon the share of household budgets devoted to food consumption.
These conclusions do not, of course, constitute the final word on this issue, for it is likely to be worthwhile revisiting this research topic in the future to extend the investigation and methodology in various directions. New research may lead to different conclusions. Alternative models of demand with advertising effects, including the Almost Ideal Demand Systems approach, should be estimated and applied perhaps to new datasets. A finer level of product detail could yield useful insights, although econometric estimation of ever larger demand systems with enormous numbers of parameters is not easily achieved. More attention could be given in future research to the possible dynamic effects of advertising, habit persistence, and the potential endogeneity within the system of both advertising and prices. These issues lie beyond the scope of what is already a rather lengthy paper, but it is hoped to investigate some of them in future research.
REFERENCES
Alston, J.M. & Chalfant, J.A. (1993) 'The silence of the lambdas: a test of the Almost Ideal and Rotterdam models', American Journal of Agricultural Economics, 75, 304-313.
Barwise, P. (1994) Children, Advertising and Nutrition. A Commentary on the 1993 National Food Alliance Report: 'Children: Advertisers' Dream, Nutrition Nightmare?' London: The Advertising Association.
Baye, M.R., Jansen, D.W. & Lee, J-W. (1992) 'Advertising effects in complete demand systems', Applied Economics, 24, 1087-1096.
Bera, A.K., Byron, R.P. & Jarque, C.M. (1981) 'Further evidence on asymptotic tests for homogeneity and symmetry in large demand systems', Economics Letters, 8, 101-105.
Bjørndal, T., Salvanes, K.G. & Andreassen, J.H. (1992) 'The demand for salmon in France: the effects of marketing and structural change', Applied Economics, 24, 1027-1034.
Boot, J.C.G., Feibes, W. & Lisman, J.H.C. (1997) 'Further methods of derivation of quarterly figures from annual data', Applied Statistics, 16, 65-75.
Brester, G.W. & Schroeder, T.C. (1995) 'The impacts of brand and
generic advertising on meat demand', American Journal of Agricultural Economics,
77,
969-979.
Brown, M.G. & Lee, J-Y. (1992) 'Theoretical overview of demand systems incorporating advertising effects', in Kinnucan, H.W., Thompson, S.R. and Chang, H-S. (Eds) Commodity Advertising and Promotion. Ames: Iowa State University Press.
Brown, M.G. & Lee, J-Y. (1993) 'Alternative specifications of advertising in the Rotterdam model', European Review of Agricultural Economics, 20, 419-436.
Brown, M.G. & Lee, J-Y. (1997) 'Incorporating generic and brand advertising effects in the Rotterdam demand system', International Journal of Advertising, 16, 211-220.
Chang, H-S. & Green, R. (1992) 'Measuring the effects of advertising on demand elasticities using time series/cross-sectional data', in Kinnucan, H.W., Thompson, S.R. & Chang, H-S. (Eds) Commodity Advertising and Promotion. Ames: Iowa State University Press.
Chang, H-S. & Kinnucan, H.W. (1991) 'Advertising, information and
product quality: the case of butter', American Journal of Agricultural Economics,
73,
1195-1203.
Clements, K.W. & Johnson, L.W. (1983) 'The demand for beer, wine and spirits: a system-wide analysis', Journal of Business, 56, 273-304.
Clements, K.W. & Selvanathan, E.A. (1988) 'The Rotterdam model and its application in marketing', Marketing Science, 7(1), 60-75.
Clements, K.W., Selvanathan, A. & Selvanathan, S. (1996) 'Applied demand analysis: a survey', The Economic Record, 72(216), 63-81.
Comanor, W.S. & Wilson, T.A. (1974) Advertising and Market Power. Cambridge, Massachusetts: Harvard University Press.
Cox, T.L. (1992) 'A Rotterdam model incorporating advertising effects: the case of Canadian fats and oils', in Kinnucan, H.W., Thompson, S.R. & Chang, H-S. (Eds) Commodity Advertising and Promotion. Ames: Iowa State University Press.
Deaton, A. & Muellbauer, J. (1980) 'An almost ideal demand system', American Economic Review, 70, 312-326.
Dibb, S.E. (1993) Children: Advertisers' Dream, Nutrition Nightmare? London: National Food Alliance.
Duffy, M. (1987) 'Advertising and the inter-product distribution of demand: a Rotterdam model approach', European Economic Review, 31(5), 1051-1070.
Duffy, M. (1991) 'Advertising and the consumption of tobacco and alcoholic drink: a system-wide analysis', Scottish Journal of Political Economy, 38:4, 369-386.
Duffy, M. (1995) 'Advertising in demand systems for alcoholic drinks and tobacco: a comparative study', Journal of Policy Modeling, 17(6), 557-577.
Duffy, M. (1996) 'An econometric study of advertising and cigarette demand in the United Kingdom', International Journal of Advertising, 15(3), 262-284.
Erlichman, J. (1993) 'Farmers join call for curb on junk food advertising', Guardian, 18 June.
Galbraith, J.K. (1967) The New Industrial State, Boston: Houghton-Mifflin.
Georgantelis, S., Phillips, G.D.A. & Zhang, W. (1987) 'Estimating and testing an Almost Ideal Demand System', in Heijmans, R.D.H. & Neudecker, H. (eds.) The Practice of Econometrics. Dordrecht: Martinus Nijhoff Publishers.
Goddard, E.W. & Amuah, A.K. (1989) 'The demand for Canadian fats and oils: a case study of advertising effectiveness', American Journal of Agricultural Economics, 71, 741-749.
Goddard, E.W. & Cozzarin, B. (1992) 'A preliminary look at advertising beef, pork, chicken, turkey, eggs, milk, butter, cheese and margarine in Canada', in Kinnucan, H.W., Thompson, S.R. & Chang, H-S. (Eds) Commodity Advertising and Promotion. Ames: Iowa State University Press.
Gorman, W.M. (1959) 'Separable utility and aggregation', Econometrica, 27, 469-481.
Green, R.D., Carman, H.F. & McManus, K. (1991) 'Some empirical methods of estimating advertising effects in demand systems: an application to dried fruits', Western Journal of Agricultural Economics, 16(1), 63-71.
Hamilton, J.L. (1972) 'The demand for cigarettes: advertising, the health
scare and the cigarette advertising ban', The Review of Economics and Statistics,
54,
401-411.
Henry, H. (1996) 'Does advertising affect total market size?', Admap, January, 16-19.
HMSO (1991) The Health of the Nation: A Strategy for Health in England, Command 1986. London: HMSO.
Ippolito, P.M. & Mathios, A.D. (1995) 'Information and advertising: the case of fat consumption in the United States', American Economic Review, Papers and Proceedings, 85(2), 91-95.
Italianer, I. (1985) 'A small sample correction for the likelihood ratio test', Economics Letters, 19, 315-317.
Jensen, H.H. & Schroeter, J.R. (1992) 'Television advertising and beef demand: an econometric analysis of "split-cable" household panel scanner data', Canadian Journal of Agricultural Economics, 40, 271-294.
Jones, E. and Choi, Y. (1992), 'Advertising of fresh and processed potato products', in Kinnucan, H.W., Thompson, S.R. & Chang, H-S. (eds.) Commodity Advertising and Promotion, Ames: Iowa State University Press.
Kinnucan, H.W., Xiao, H., Hsia, C-J. & Jackson, J.D. (1997) 'Effects of health information and generic advertising on US meat demand', American Journal of Agricultural Economics, 79, 13-23.
Laitinen, K. (1978) 'Why is demand homogeneity so often rejected?', Economics Letters, 1, 187-191.
Lee, J-Y. & Brown, M.G. (1992) 'Commodity versus brand advertising: a case study of the Florida orange juice industry', in Kinnucan, H.W., Thompson, S.R. & Chang, H-S. (Eds) Commodity Advertising and Promotion. Ames: Iowa State University Press.
Lindley, D.V. & Scott, W.F (Eds) (1984) New Cambridge Elementary Statistical Tables. Cambridge, UK: Cambridge University Press.
Marks, L. (1985) 'Policies for a prudent diet', Food Policy, 10(2), 166-174.
Meisner, J.F. (1979) 'The sad fate of the asymptotic Slutsky symmetry test for large systems', Economics Letters, 2, 231-233.
Ministry of Agriculture, Fisheries and Food (1990) Household Food Consumption and Expenditure: 1988. London: HMSO.
Mizon, G.E. (1977) 'Inferential procedures in non-linear models: an application in a UK industrial cross-section study of factor substitution and returns to scale', Econometrica, 45, 1221-1242.
Mountain, D.C. (1988) 'The Rotterdam model: an approximation in variable space', Econometrica, 56(2), 477-484.
Pollak, R.A. & Wales, T.J. (1992) Demand System Specification and Estimation. Oxford: Oxford University Press.
Stewart, M.J. (1993) 'The effect on tobacco consumption of advertising bans in OECD countries', International Journal of Advertising, 12, 155-180.
Strotz, R.H. (1957) 'The empirical implications of a utility tree', Econometrica, 25, 269-280.
Theil, H. (1975) Theory and Measurement of Consumer Demand. Volumes I and II, Amsterdam: North Holland Publishing Company.
Theil, H. (1980) System-wide Explorations in International Economics, Input-Output Analysis and Marketing Research. Amsterdam: North Holland Publishing Company.
Venkateswaran, V. and Kinnucan, H.W. (1990) 'Evaluating fluid milk advertising in Ontario: the importance of functional form', Canadian Journal of Agricultural Economics, 38, 471-488.
Wallis, K.F. (1974) 'Seasonal adjustment and relations between variables', Journal of the American Statistical Association, 69, 18-31.
Ward, R.W. (1992), 'Discussion: generic and brand advertising', in Kinnucan, H.W., Thompson, S.R. and Chang, H-S. (Eds) Commodity Advertising and Promotion. Ames: Iowa State University Press.
Ward, R.W. and Dixon, B.L. (1989) 'Effectiveness of fluid milk advertising since the Dairy and Tobacco Adjustment Act of 1983', American Journal of Agricultural Economics, 71, pp 730-740.
| Variable | Source and definition |
| qi | Consumers' expenditure on the ith food category at constant (1990) prices, divided by the UK resident population (all persons, mid-year estimates, denoted by POP). All consumers' expenditure data used in this study were extracted from the Office of National Statistics Macroeconomic Database and the University of Manchester Computing Centre. |
| wi | The budget share for the ith food category: calculated as consumers' expenditure at current prices on that category of food as a proportion of consumers' total expenditure at current prices on all types of food plus soft drinks. |
| di | Advertising expenditure on the ith category of food deflated by the product of POP and PA, the Advertising Association combined index of media rates (discounted basis). Sources of advertising data: Statistical Review of Press and TV Advertising, Legion Publishing Services, and Quarterly Digest of Advertising Expenditure, Media Expenditure Analysis Ltd (MEAL). Other sources: for PA, The Advertising Statistics Yearbook (various years), The Advertising Association, London; for POP, Annual Abstract of Statistics (various issues), HMSO, London. |
| pi | The price of food item i, calculated as the implicit deflator for that good, i.e. as the ratio of expenditure on that good at current prices to expenditure on the good at constant 1990 prices. |
Note: Quarterly figures for POP and PA were interpolated from annual data using the procedures described in Boot et al. (1997). |
|
Data on consumers' expenditure at current and constant 1990 prices and firms' (press, TV and radio) advertising expenditure were obtained for 11 food categories. Since the consumers' expenditure and the advertising data come from different sources, an attempt was made to collect the advertising series into product groupings which correspond as closely as possible to the national income accounts definitions. Table A2 opposite lists these categories, and indicates the items included under each heading.
| Consumers' expenditure - national income accounts
classifications and items included |
MEAL classifications and items included |
| Bread and cereals | |
| Bread, flour, cakes, biscuits, cereal, breakfast foods, oatmeal, rice, barley products, semolina, pasta, sago, tapioca, arrowroot, cornflour, custard and blancmange powders | Biscuits; bread, bakeries; cakes, fruit pies; cake, pastry mixes; cereals (for preparation); cereals (ready to eat); crispbread, slimming breads; dried rice, pasta; flour, baking powder; custard, cornflour |
| Meat and bacon | |
| Meat, offal, bacon and ham, rabbits, game, poultry, sausages, corned beef and other meat products | Canned meat, poultry; fresh-frozen meat and poultry; frozen, ready-to-eat meals and frozen cooked meat; meat, fish pastes, meat pies, sausages, bacon; meat, vegetable extracts and pie fillings; ready-to-eat meals (canned, dried) |
| Fish |
|
| Includes shellfish | Canned fish; fresh, fresh-frozen fish; meat, fish pastes |
| Milk, cheese and eggs | |
| Liquid, condensed and powdered milk; cream, yoghurt, cheese and eggs | Cheese; eggs; milk, milk products (excluding cream); sweet toppings (including cream); yoghurt |
| Oils and fats | |
| Butter, margarine, lard, other edible fats | Butter; margarine; suet, cooking fats, vegetable oils |
| Fruit | |
| Fresh, canned, dried, frozen and crystallised fruit and nuts. Excludes fruit juices | Canned fruit; dried fruit; fresh fruit and vegetables |
| Potatoes and vegetables | |
| Potatoes, potato crisps and other products; fresh, canned, dried and frozen vegetables; | Canned and processed peas; canned vegetables, pasta; fresh fruit, vegetables; pickles and sauces. Excludes soups and frozen vegetables; potato crisps, snacks; juices. sauces, pickles and salad cream |
| Sugar, preserves and confectionery | |
| Refined beet or cane sugar; syrup and treacle; jam, marmalade and table jellies; honey; chocolate and sugar confectionery | Sugar; chewing-gum; chocolate confectionery; convenience desserts; frozen confectionery; jam, preserves, junkets, jellies; sugar confectionery |
| Coffee, tea and cocoa | |
| Coffee, tea, cocoa and malted drinks | Coffee, coffee extracts; tea; cocoa and drinking chocolate |
| Soft drinks | |
| Fruit juices and squashes; lemonade and mineral waters | Soft drinks |
| Other manufactured food | |
| Infant and invalid foods; soups; ice cream; condiments and seasonings; other manufactured foods | Baby food; infant food; condiments; food drinks; health drinks; ice cream, lollies; soups, packet; food speciality and range |
Note: The left-hand column of this table is an extract from United Kingdom National Accounts: Sources and Methods (third edition, 1985), London: Her Majesty's Stationery Office, Table 6Bb, p 67. |
|
 http://www.warc.com | © Advertising Association |